

Research your next location
Opening a restaurant, gym, salon or clinic? Zoningly compares local demand with the businesses already serving it in each ZIP code, estimates what it costs to open there, and builds a sourced business case – in one workspace.
Public data sources. Inputs, not endorsements.
 Census
 BLS
 IRS
 HUD
 FRED
 OpenStreetMap
Rank ZIP codes in Seattle for a specialty coffee shop by demand gap, then model the cost of entry.
Scoring demand vs. supply across 41 ZCTAs, pulling rents, wages and permit activity…
Specialty Coffee – Seattle, FY 2026
Four report sections, read across 41 ZIP areas. Demand is growing; entry effort and cost are the watch-items.
38 coffee shops in the ZIP · 7.1 per 10,000 residents
53,600 residents · median household income $118k
$58k–$84k to open · rent and wages near the metro median
Coffee shops across the metro +4% a year, ahead of the national rate
Example: ZIP 98115 – demand runs ahead of the metro's typical level; entry cost $58k–$84k.
One score that reads like elevation.
The gap score measures resident demand against existing supply for a niche, in one place. Low ground is crowded. High ground has fewer businesses per resident than is typical for the metro. Then we layer the economics on top.
Demand vs. supply gap
Spending power and population modeled against the count of established competitors in each ZCTA.
Cost of entry
Rent, labor, utilities, build-out, permits and financing combine into a sourced dollar range – not a guess.
Momentum & macro
Quarter-over-quarter trend plus a rate-cycle read tells you whether the wind is at your back.
Pick a niche. See where demand runs ahead of supply.
Every niche, ranked for your city – gap score, top ZIP area, competitor count, and the chips that tell you trend and macro tailwind at a glance.
Specialty Coffee
EV Charging
Grocery & Specialty
Veterinary
Pet Grooming
Co-working
Local numbers, with their sources – on your side.
Whether it's your first storefront or your fortieth, Zoningly meets you where you are.
Aspiring founders
See whether there's room for one more business like yours, with the numbers behind it.
- Ranked niche grid with personal-fit
- Plain-language gap rationale
- Guided onboarding
Operating businesses
Scouting the next location. Compare candidate ZIP areas with cost of entry, rent and wages beside the demand reading.
- Side-by-side ZCTA comparison
- Cost, trend & demographics
- Recent permit activity
Investors & consultants
The PDF is the deliverable, the dashboard is the workbench. Density welcome.
- A PDF with a source on every figure
- Comparable ZIPs and SBA loan activity
- Multiple projects
From blank map to signed lease.
Pick your industry & city
Coffee shop in Austin. Dentist in Phoenix. Gym in Tampa. Tell us what you want to open and where.
We score every ZIP code
Demand – who lives there, income, growth, who's moving in – measured against supply: how many businesses like yours already operate.
See where the numbers line up
Demand ahead of the businesses already there, with the cost of entry beside it. The decision stays yours.
Everything you need to size a market – organized by capability.
Each Zoningly capability answers a specific question. Use one, combine several, or ask Zoningly AI about the place you have in mind.
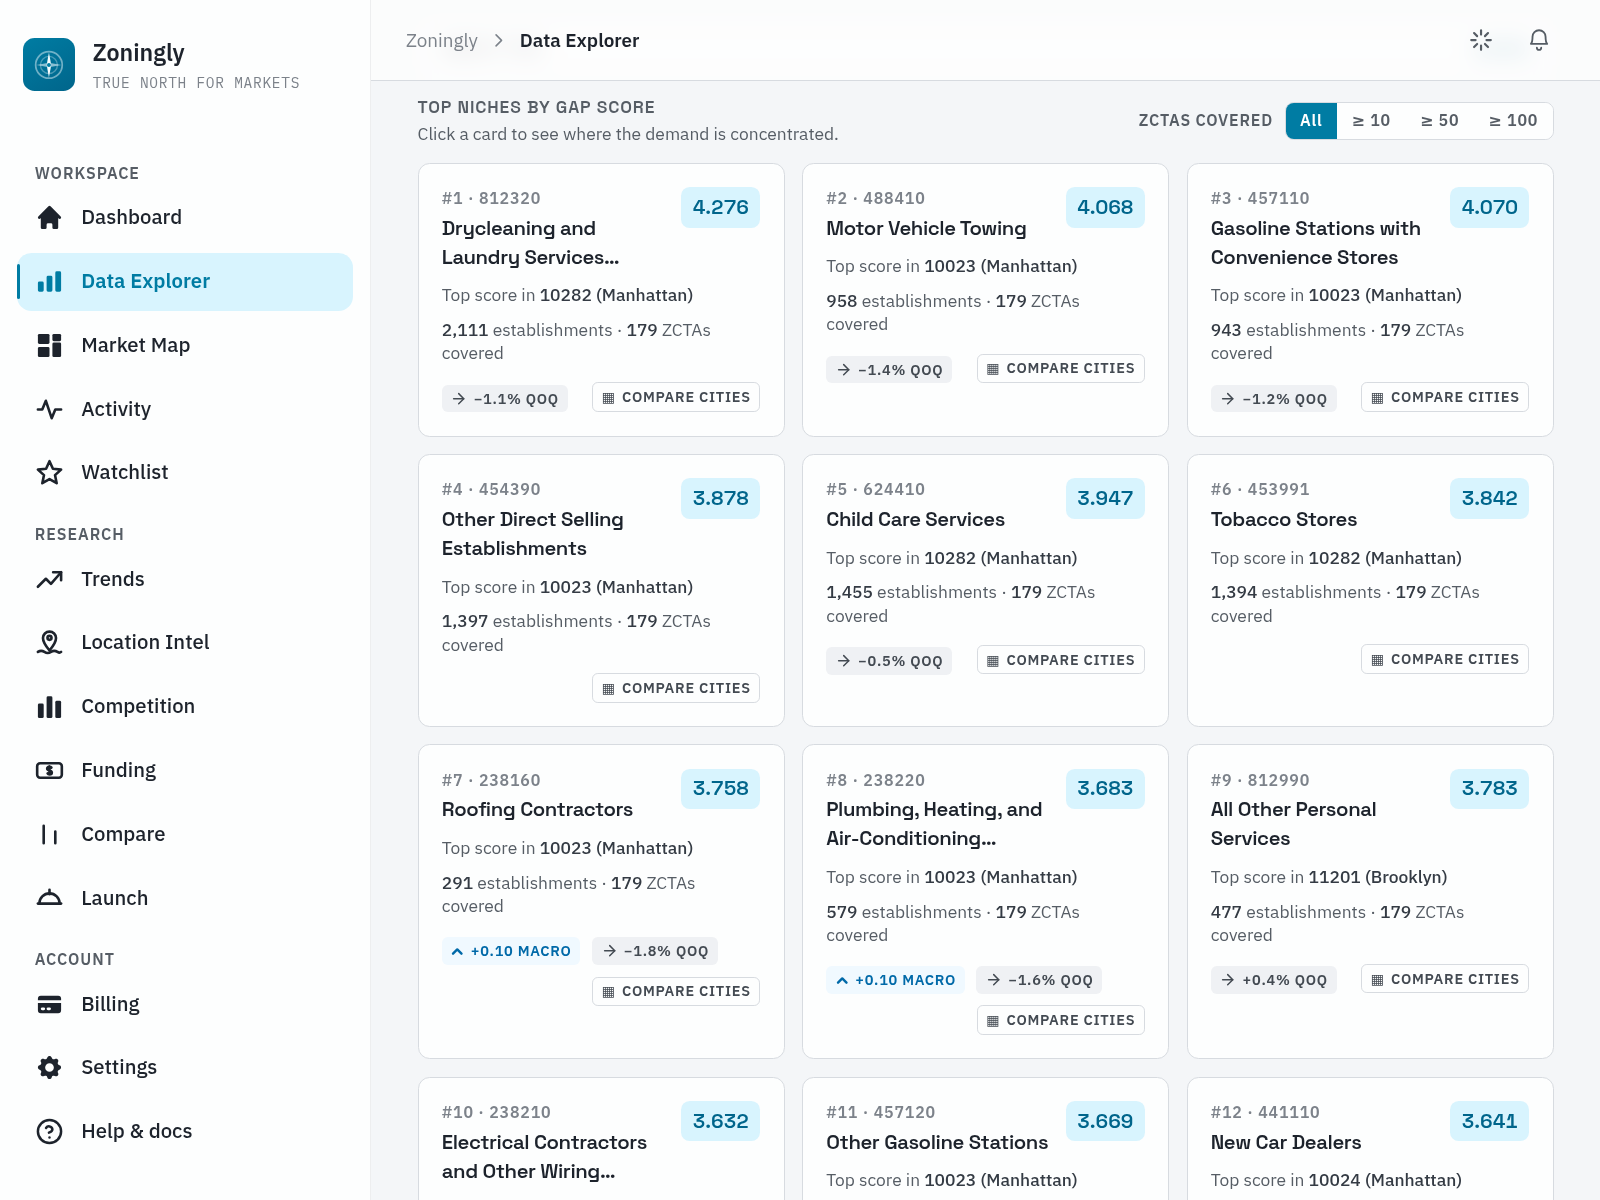
Explore every market in one view
Search any city and niche, then read ZIP areas across the U.S. on one map – demand, supply and the gap between them.
- Cities, niches & ZCTA-level map
- Demand vs. supply at a glance
- Filter by demographics & fit
- Drill into any ZIP instantly
One workspace. ZIP areas across the U.S. – see the coverage map on /data.
See where you can explore today.
Data for over 20,000 ZIP areas in all 50 states
Across more than 900 metro areas, plus Washington, D.C. and Puerto Rico.
- Deep coverage
- Good coverage
- Growing coverage
- Coming soon
Coverage by state (52)
- AlabamaGood coverage
- AlaskaGrowing coverage
- ArizonaDeep coverage
- ArkansasGrowing coverage
- CaliforniaDeep coverage
- ColoradoGood coverage
- ConnecticutDeep coverage
- DelawareDeep coverage
- District of ColumbiaGrowing coverage
- FloridaDeep coverage
- GeorgiaGood coverage
- HawaiiDeep coverage
- IdahoGood coverage
- IllinoisGood coverage
- IndianaGood coverage
- IowaGrowing coverage
- KansasGrowing coverage
- KentuckyGrowing coverage
- LouisianaGood coverage
- MaineGrowing coverage
- MarylandGood coverage
- MassachusettsDeep coverage
- MichiganGood coverage
- MinnesotaGood coverage
- MississippiGood coverage
- MissouriGrowing coverage
- MontanaGrowing coverage
- NebraskaGrowing coverage
- NevadaGood coverage
- New HampshireDeep coverage
- New JerseyDeep coverage
- New MexicoGrowing coverage
- New YorkGood coverage
- North CarolinaGood coverage
- North DakotaGrowing coverage
- OhioGood coverage
- OklahomaGrowing coverage
- OregonGood coverage
- PennsylvaniaGood coverage
- Puerto RicoDeep coverage
- Rhode IslandDeep coverage
- South CarolinaGood coverage
- South DakotaGrowing coverage
- TennesseeGood coverage
- TexasGood coverage
- UtahGood coverage
- VermontGood coverage
- VirginiaGood coverage
- WashingtonGood coverage
- West VirginiaGrowing coverage
- WisconsinGood coverage
- WyomingGrowing coverage
More powerful. More affordable.
Start free, forever. Upgrade when you need the cost model, the trend detail and the export.
- Nationwide ZCTA map, cities & niches
- Base gap score & demographics
- Customer-fit analysis
- Cost of entry & momentum
The depth to put a sourced case in front of a lender.
Plus applicable tax · 14-day money-back guarantee
Upgrade to Pro- Full cost-of-entry breakdown
- Momentum & seasonality drill-down
- Sourced PDF export & share links
Shared workspaces and seats for advisory & real-estate teams.
2 seats included – $29 per seat / month, plus applicable tax
Contact us- Shared workspaces & projects, from 2 seats
- White-label PDF exports
- CSV export of rankings & compares
- Centralized team billing
- Priority support

See Zoningly on a live map of your market.
Book a 30-minute walkthrough. We'll pull up your city, your niche, and show you the gap score, cost model and the PDF you'd hand an investor – then answer anything.
- A guided tour of the data explorer & ZCTA map
- A live gap-score read on a market you choose
- Pricing, onboarding & team rollout – answered

Questions, answered.
People opening or expanding a local business in the U.S. – a restaurant, café, gym, salon, clinic, shop or service – who want local numbers before choosing a location. You pick the business type; Zoningly compares local demand with the businesses already serving it in each ZIP code and estimates what opening there costs.
No. Zoningly assesses a place for a type of business, not a property. It does not value buildings, inspect homes, estimate rents for landlords or find deals to flip. Once you know which ZIP code fits your business, you still choose the site itself with a broker, a lease review and a visit.
17 public datasets from 11 publishers – Census, BLS, IRS, HUD, FRED, OpenStreetMap and more – each with its publisher's release schedule and reuse terms on /data. Business locations also come from city business-license and federal registry feeds, named there.
We model resident demand – population, income, growth and who's moving in – against existing supply, the count of businesses like yours already operating. 0 is typical for the metro; higher means more room for a newcomer; below 0 means the area is already well served. The score has no fixed top.
Coverage is ZIP-level. The coverage map on /data shows how deep coverage runs in each state; inside the app the map goes down to every covered ZIP area.
Yes. The ZCTA map, demographics, customer-fit and the base gap score are free forever, no card required. Pro adds the full cost-of-entry model, momentum and seasonality drill-down, and sourced PDF export with share links.
Yes. Pro exports a business-case PDF for one ZIP and business type: population and income, existing competitors, cost of entry, employment trend, SBA loan activity and comparable ZIPs, each with its source and vintage.
Before you sign a lease, start with the map.
Founders, operators and investors use Zoningly to check a place against demand, competition and cost before they commit.
- Coto de Caza92679 · 10 salons nearbyRoom to open
- Rancho Mission Viejo92694 · 78 salons nearbyRoom to open
- Irvine92620 · 64 salons nearbyRoom to open
Every ZIP in the metro, crowded ones included, gets a reading: Room to open, Typical for the metro, or Crowded. A starting point, not a verdict.